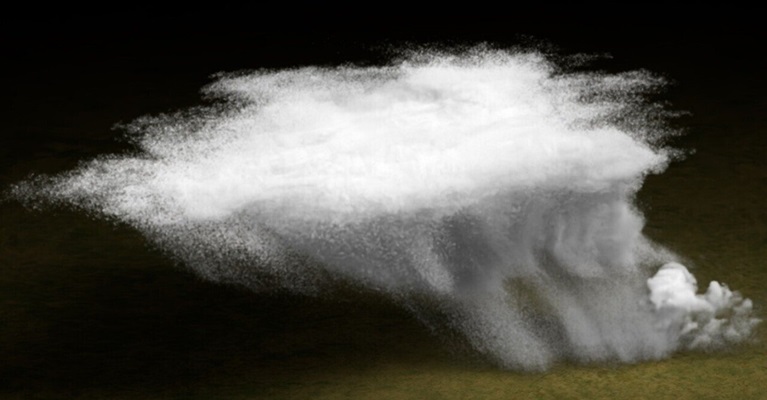
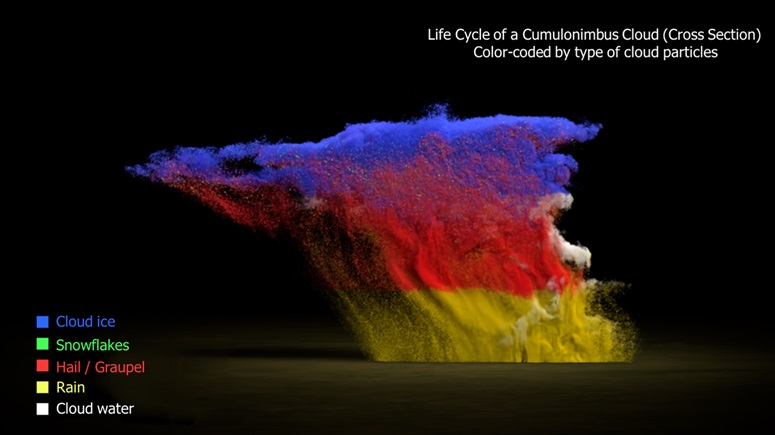
We conducted a high-resolution simulation of an isolated cumulonimbus cloud using the Super-Droplet Method (SDM), then converted the simulation output into CG imagery to visualize the cloud’s evolution and internal microphysical structure.
Simulation Setup
- Model approach: Super-Droplet Method (particle-based cloud microphysics)
- Horizontal grid spacing: 62.5 m
- Domain size: 60 x 60 x 25 km
- Output: physically based simulation rendered as CG for intuitive interpretation
Why This Matters
This work supports Moonshot Goal 8 research on severe-weather understanding and control-oriented forecasting. As discussed in Prof. Shima’s interview, several points directly connect to this simulation:
- SDM represents massive particle populations with representative super-droplets, enabling detailed cloud-particle evolution at feasible computational cost.
- Compared with traditional bulk approaches, SDM is better suited for resolving fine microphysical processes and aerosol-related effects.
- These simulations are still computationally expensive (for example, a short cloud event can require roughly one week of compute), which is why algorithmic acceleration, supercomputing, and AI-assisted pathways are being developed for future operational use.
Official Links
- Video (JST / Moonshot context): YouTube
- Interview reference: Science Japan interview with Prof. Shima
Comments